
Registered Unemployment in the Silesian Voivodship at the end of June 2011
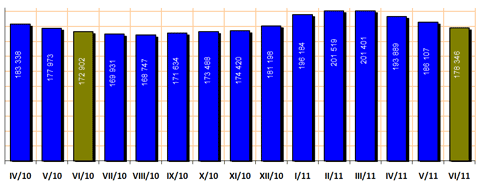
The number of the unemployed registered in the labour offices at the end of June 2011 amounted to 178,3 thous. persons (99,2 thous. of which constituted females), and it was lower than the one observed at the end of the previous month by 7,8 thous. persons.
Traditionally, territorial differentiation of unemployment in the Silesian Voivodeship was noted. At the end of June 2011, the highest number of registered unemployed persons was reported in the cities with powiat status : Częstochowa (12,951), Sosnowiec (10,665) and Bytom (10,464). The lowest number of registered unemployed persons was reported in powiats : bieruńsko-lędziński (1,339) and rybnicki (1,870).
The unemployment rate at the end of June 2011 comprised 9,7% of the economically active civilian population. It was by 2,1 point lower than in the country (11,8%).
There was still observed a very high territorial differentiation of unemployment. The highest unemployment rate was observed in powiats : myszkowski (19,5%) and city with powiat status Bytom (18,1%). The lowest unemployment rate characterized city with powiat status Katowice (4,1%) and bieruńsko - lędziński (5,2%).
Unemployed persons registered in labour offices, as of the end of month
The majority of the unemployed population constituted women. The number of unemployed women at the end of June 2011 amounted to 99,208 which constituted 55,6% of the total number of the registered unemployed persons.
There were 26,611 persons possessing benefit rights, which comprised 14,9% of the total number of the registered unemployed (in the previous month it was 27,924 persons). Among this group of the unemployed 56,9% constituted females.
In June 2011 the number of the newly registered (so called "inflow to unemployment" [1] ) was 19,205 persons (52,2% of which were females). It was higher than the same period of the previous month by 185 persons, including 4,371 (22,8%) registered for the first time, and 14,834 (77,2%) registered for the subsequent time.
The number of unemployed withdrawn from labour office registers in poviat labour offices (so called "outflow from unemployment" [2] ) constituted 26,966:
- 10,578 of the unemployed were withdrawn because of unreadiness to take up a job;
- 10,235 of the unemployed were withdrawn from labour offices registers due to taking up a job;
- 1,316 started in traineeships.
The unemployed residents of rural area constituted 21,0% of the total number of persons registered in poviat labour offices (37,418 persons). Only 5,2% (1,954 persons) of the unemployed rural residents are unemployed farm owners.
Unemployed persons with a specific situation on labour market are, among others, without secondary education, who constituted 56,2% of the total number of registered unemployed persons at the end of June 2011. Long-term unemployed[3] persons amounted to 43,7%. The share of registered unemployed persons without occupational qualifications constituted 29,9% of the total number of registered unemployed persons, 25,9% of those without professional experience. People over 50 years old - 23,6%, while people aged 25 and below constituted 18,4% of the total number.
Women, who after the birth of child did not undertake employment amounted to 18,022. Bringing up single-handed at least one child aged 18 and below (17,012). The disabled persons and the unemployed, who after undergoing imprisonment penalty did not undertake employment constituted respectively 10,778 and 4,224. Effective after a social contract is finished amounted to 202 persons.
In June 2011 poviat labour offices received 8,398 vacancies and places for vocational activation. At the end of month, labour offices had vacancies and places for vocational activation for 7,096 persons (2,1 thous. comprised vacancies and places for vocational activation not undertaken for a period exceeding one month).
The number of persons dismissed due to company reasons amounted to 447 persons.
The unemployed by sex, age, educational level and duration of unemployment
Structure of registered unemployed persons by sex (as of the end of quarter)
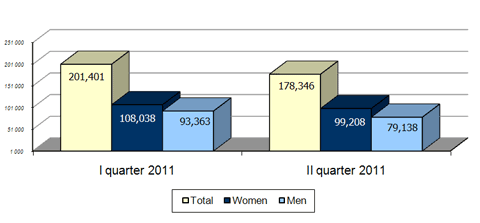
The majority of the unemployed population constituted women. At the end of the II quarter of 2011, the share of women in the total number of the unemployed amounted to 55,6%. The highest number of women among the total unemployed persons was reported in : Żory (66,3%) and Jatrzębie Zdrój (64,9%).
At the end of the presented period, the largest group among the unemployed constituted persons aged 25-34 years. Their number amounted to 53,2 thous. (29,8%).
The percentage share of registered unemployed persons at the age 45-54 years comprised 21,2%, 35-44 years - 18,9%, 18-24 years - 18,4% while persons aged over 54 constituted 11,7%.
The majority of the unemployed registered in the labour offices comprised persons with relatively low level of education. The two largest groups among the unemployed constituted persons with lower secondary, primary and incomplete primary education and basic vocational education (their shares amounted respectively to 28,4% and 27,8% of the total number of unemployed registered at the end of II quarter 2011). The certificate of completion of post-secondary and vocational secondary schools had 23,1% of the total number of the unemployed, the graduates from tertiary schools constituted 10,9% and general secondary schools completed 9,9%.
The number of persons seeking employment for a long time (over 12 months) amounted to 47,0 thous. at the end of the II quarter of 2011. It constituted 26,4% of the total number of the registered unemployed. Persons staying without a job for a relatively short duration, i.e up to 1 month constituted 10,0%, between 1 and 3 months - 15,5%, between 3 - 6 months - 22,6%, while those who stayed without a job from 6 to 12 months comprised 25,6% of the total number of the unemployed.
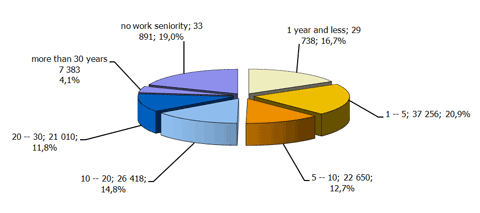
Structure of registered unemployed persons by work seniority (at the end of the II quarter of 2011)
REGISTERED UNEMPLOYED PERSONS IN POWIAT LABOUR OFFICES BY SUBREGIONS / POWIATS
Subregions / powiats | Registered unemployed persons (30thJune, 2011) | Unemployment rate in % | ||||
total | of total | |||||
women | share of women in the total number of unemployed (%) | unemployed persons entitled to benefit | in rural areas | |||
Slaskie Voivodship | 178,346 | 99,208 | 55,6 | 26,611 | 37,418 | 9,7 |
Subregion bielski | 23,846 | 12,690 | 53,2 | 4,372 | 12,300 | 8,9 |
p. bielski | 4,722 | 2,491 | 52,8 | 962 | 3,295 | 9,6 |
p. cieszyński | 6,549 | 3,488 | 53,3 | 1,172 | 3,461 | 9,8 |
p. żywiecki | 6,935 | 3,691 | 53,2 | 1,171 | 5,544 | 12,4 |
c. Bielsko-Biała | 5,640 | 3,020 | 53,5 | 1,067 | 0 | 5,9 |
Subregion bytomski | 21,573 | 12,184 | 56,5 | 2 515 | 3,368 | 14,1 |
p. lubliniecki | 3,203 | 1,737 | 54,2 | 438 | 1,968 | 12,3 |
p. tarnogórski | 5,281 | 2,953 | 55,9 | 700 | 1,400 | 10,5 |
c. Bytom | 10,464 | 5,967 | 57,0 | 1,061 | 0 | 18,1 |
c. Piekary Śląskie | 2,625 | 1,527 | 58,2 | 316 | 0 | 13,8 |
Subregion częstochowski | 29,062 | 14,475 | 49,8 | 4 750 | 11,058 | 13,5 |
p. częstochowski | 7,454 | 3,614 | 48,5 | 1,176 | 6,226 | 16,7 |
p. kłobucki | 3,827 | 1,973 | 51,6 | 622 | 2,918 | 12,2 |
p. myszkowski | 4,830 | 2,565 | 53,1 | 1,042 | 1,914 | 19,5 |
c. Częstochowa | 12,951 | 6,323 | 48,8 | 1,910 | 0 | 11,2 |
Subregion gliwicki | 17,353 | 10,003 | 57,6 | 2 031 | 1,294 | 9,0 |
p. gliwicki | 3,381 | 1,968 | 58,2 | 432 | 1,294 | 9,3 |
c. Gliwice | 6,429 | 3,520 | 54,8 | 796 | 0 | 6,7 |
c. Zabrze | 7,543 | 4,515 | 59,9 | 803 | 0 | 12,3 |
Subregion katowicki | 23,602 | 13,375 | 56,7 | 3 720 | 0 | 6,5 |
c. Chorzów | 4,466 | 2,435 | 54,5 | 598 | 0 | 10,9 |
c. Katowice | 8,411 | 4,544 | 54,0 | 1,384 | 0 | 4,1 |
c. Mysłowice | 2,430 | 1,491 | 61,4 | 417 | 0 | 8,1 |
c. Ruda Śląska | 3,772 | 2,328 | 61,7 | 572 | 0 | 7,7 |
c. Siemianowice Śląskie | 2,623 | 1,442 | 55,0 | 466 | 0 | 12,6 |
c. Świętochłowice | 1,900 | 1,135 | 59,7 | 283 | 0 | 14,3 |
Subregion rybnicki | 19,159 | 12,163 | 63,5 | 2 506 | 3,375 | 8,8 |
p. raciborski | 2,693 | 1,635 | 60,7 | 340 | 949 | 7,7 |
p. rybnicki | 1,870 | 1,178 | 63,0 | 262 | 1,005 | 11,3 |
p. wodzisławski | 5,044 | 3,184 | 63,1 | 630 | 1,421 | 10,2 |
c. Jastrzębie Zdrój | 3,550 | 2,305 | 64,9 | 392 | 0 | 8,8 |
c. Rybnik | 4,030 | 2,554 | 63,4 | 569 | 0 | 7,0 |
c. Żory | 1,972 | 1,307 | 66,3 | 313 | 0 | 9,9 |
Subregion sosnowiecki | 33,516 | 18,261 | 54,5 | 4 709 | 3,640 | 12,9 |
p. będziński | 6,897 | 3,711 | 53,8 | 977 | 1,364 | 14,1 |
p. zawierciański | 7,173 | 3,890 | 54,2 | 830 | 2,276 | 16,1 |
c. Dąbrowa Górnicza | 5,792 | 3,100 | 53,5 | 943 | 0 | 10,6 |
c. Jaworzno | 2,989 | 1,783 | 59,7 | 508 | 0 | 9,9 |
c. Sosnowiec | 10,665 | 5,777 | 54,2 | 1,451 | 0 | 13,2 |
Subregion tyski | 10,235 | 6,057 | 59,2 | 2 008 | 2,383 | 5,9 |
p. mikołowski | 2,716 | 1,582 | 58,2 | 447 | 285 | 7,1 |
p. pszczyński | 2,638 | 1,652 | 62,6 | 459 | 1,850 | 6,0 |
p. bieruńsko-lędziński | 1,339 | 815 | 60,9 | 291 | 248 | 5,2 |
c. Tychy | 3,542 | 2,008 | 56,7 | 811 | 0 | 5,4 |
C - city with poviat status;
Department of Labour Market Observatory
[1] Inflow to unemployment - means the number of persons, who were registered with poviat labour offices during a month, quarter and year.
[2] Outflow from unemployment - means the number of persons who within a year were withdrawn from labour office registeres, due to different reasons, i.e., taking up permanent or seasonal job, starting interventional or public work, unreadiness to work, entering education, acquirement of pension rights, etc.
[3] Persons without employment taken up for 12 months within recent 24 months.